

/analytics/throughput) measures run volume and execution time. It separates a
workspace overview from sortable workflow performance and the slowest recorded steps.
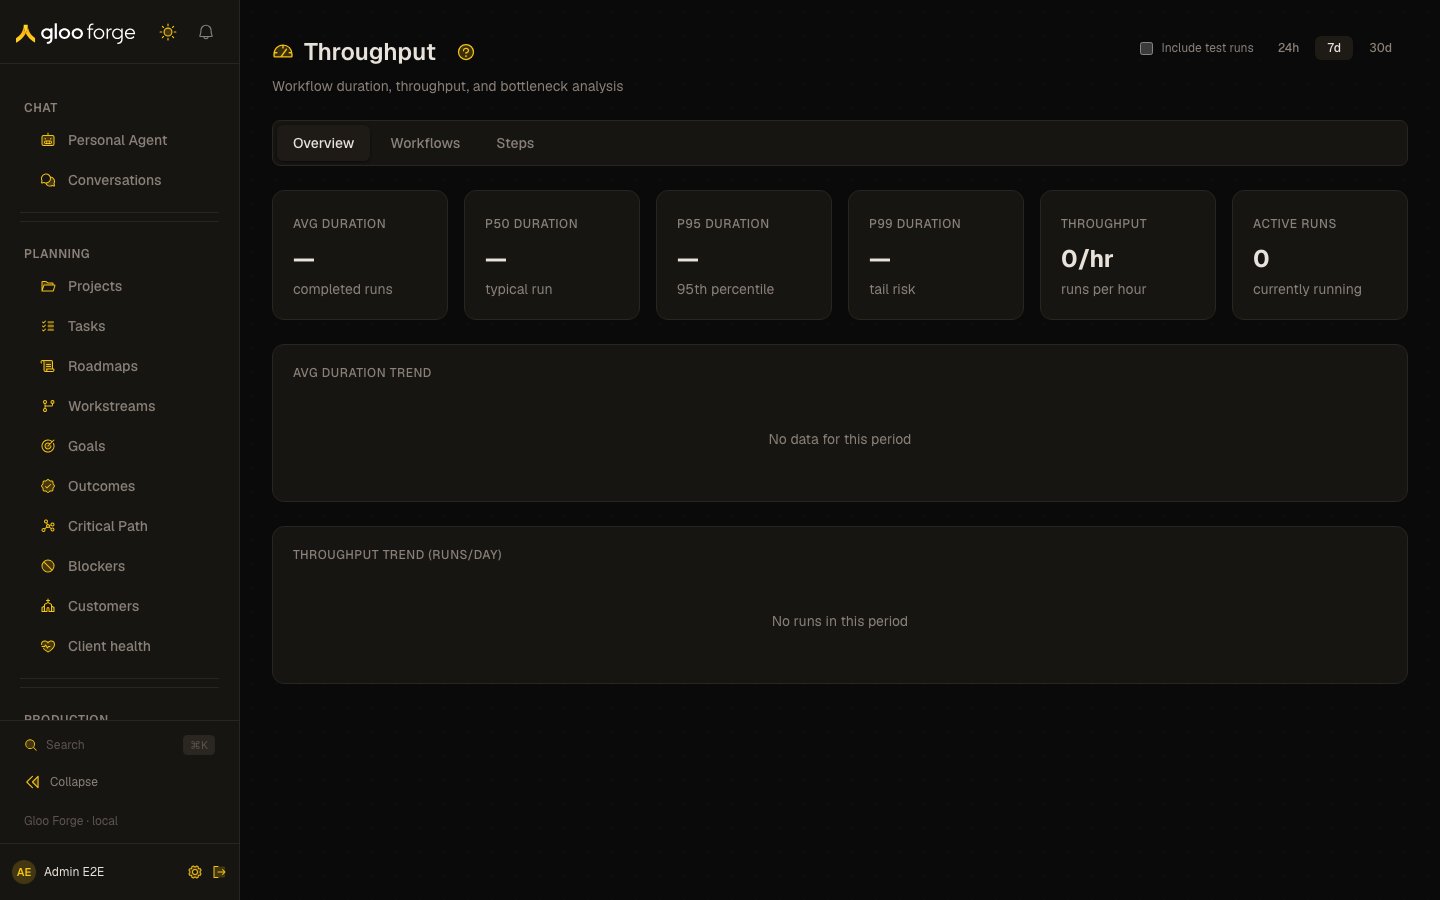
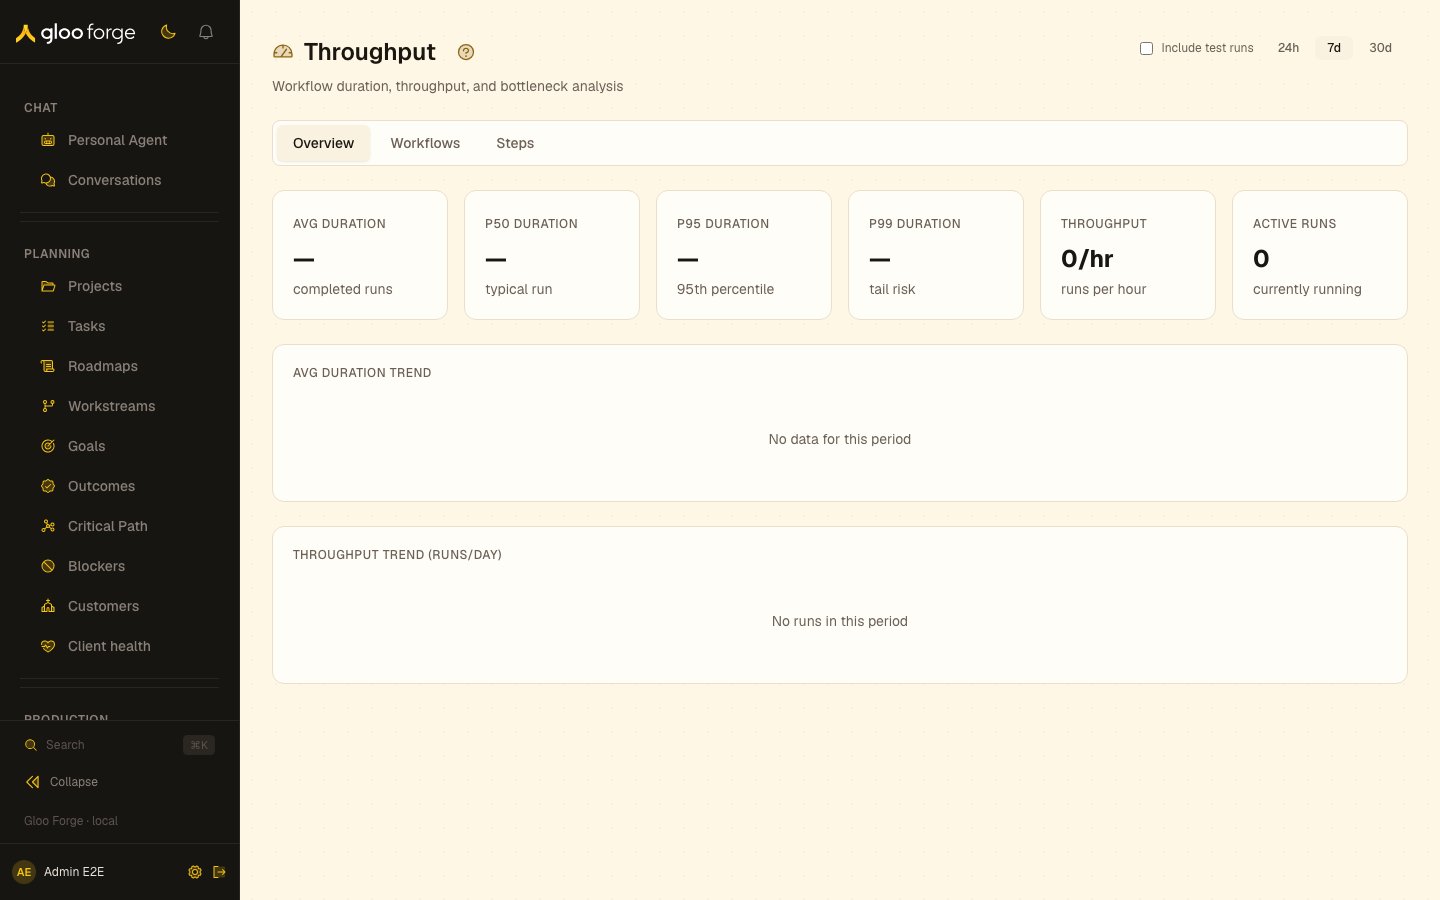
Throughput — Forge Console at /analytics/throughput
What you can do
- Choose 24h, 7d, or 30d. Summary trend indicators compare that window with the preceding window of the same length.
- Use Overview for average, P50, P95, and P99 duration, runs per hour, active runs, and the daily duration and run-count charts.
- Use Workflows to sort completed-run performance by workflow, average duration, run count, success rate, average cost, or last run. A workflow name opens its detail page.
- Use Steps to inspect the slowest step IDs by average duration and execution count.
- Test runs are excluded by default from the overview and workflow rollups. Include them when you are diagnosing authoring or development executions.
Key state to watch
- Tail duration — P95 and P99 expose slow outliers that the average and P50 can hide.
- Throughput trend — the chart uses runs per day while the summary card reports runs per hour; read the units before comparing them.
- Missing rows — workflow statistics appear after runs complete, and step statistics after steps complete. An empty tab is not proof that dispatch is unavailable.
Related surfaces
- Reliability: success and failure rates for the same window.
- Traces: step spans and timing for a slow run.
- Runs: follow an active run.