

/) opens your default dashboard. Use it for a starting overview, then open the owning run, review queue, or record to act on work.
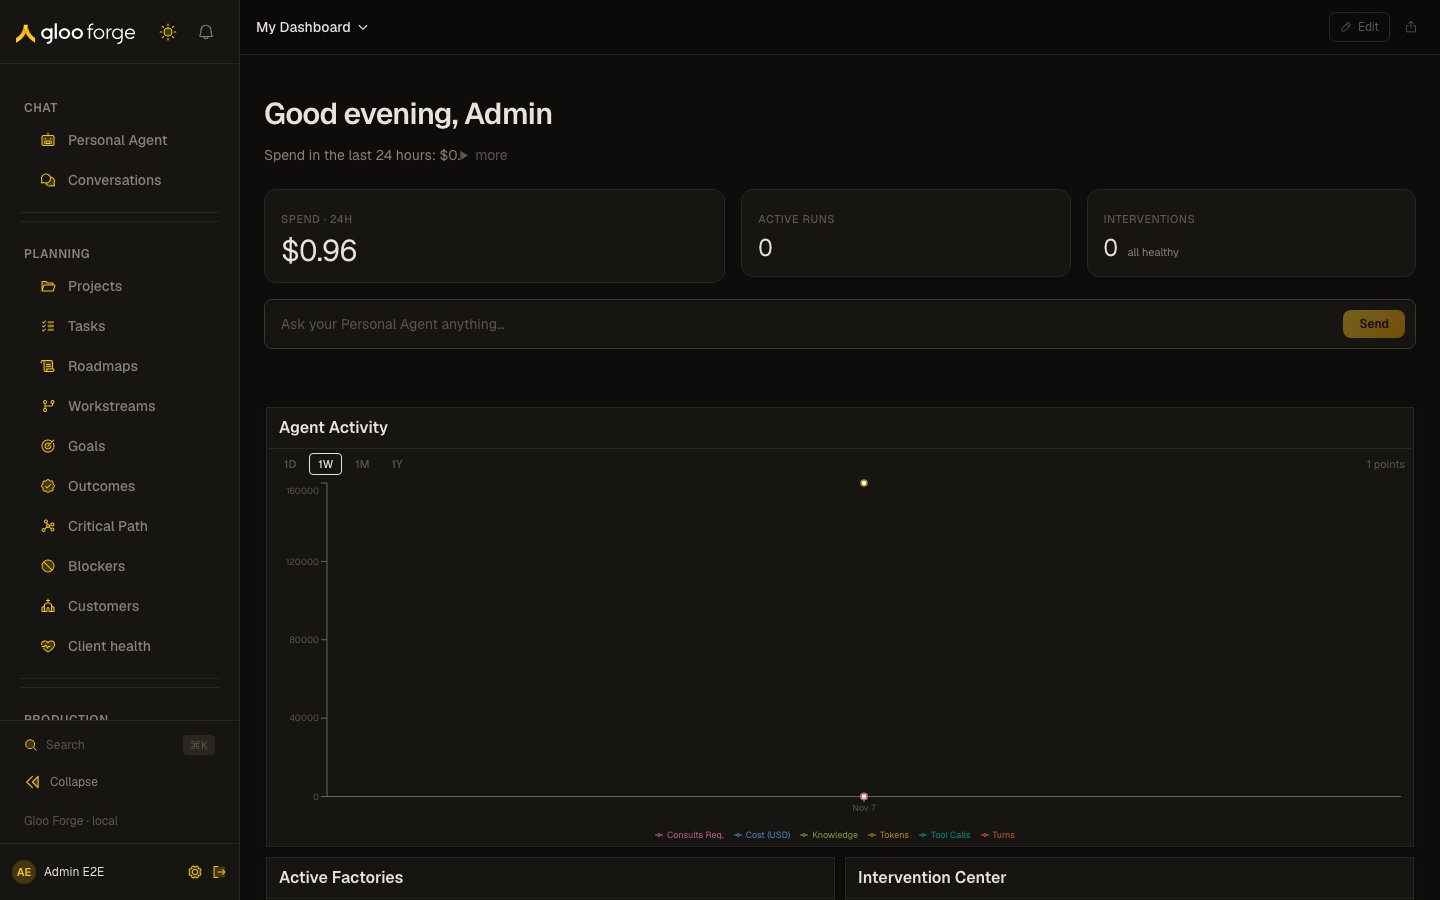
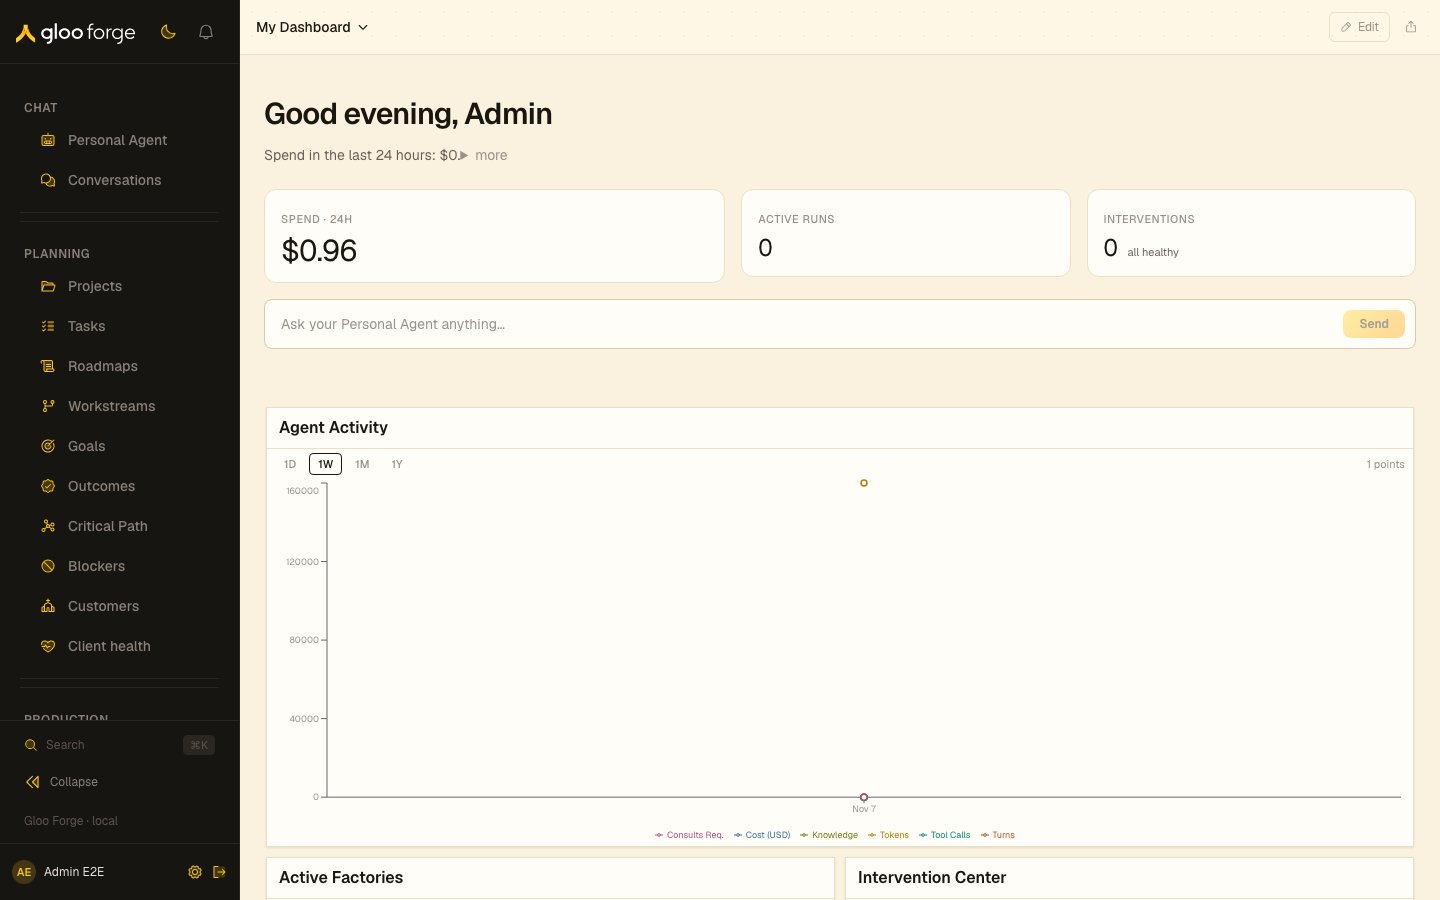
Use your dashboard — Forge Console at /
What you can do
- Read your default dashboard’s briefing and summary metrics. See Read the default dashboard.
- Switch to another dashboard of yours, or one shared with you. See Switch dashboards.
- Add, arrange and remove widgets on a dashboard you own. See Edit a dashboard you own.
- Export the grid as a PDF snapshot. See Export a snapshot.
Read the default dashboard
The default dashboard has a greeting and briefing above three summary metrics: Spend · 24h, Active runs, and Interventions. The Personal Agent input opens a conversation with your request. Other widgets appear in the grid below. The briefing and summary metrics use the dashboard’s widget data. A missing or unavailable value is not proof of zero activity. Open the owning page when you need the underlying records or current decision context. This header appears on your default dashboard. A different saved or shared dashboard can show a different grid and does not necessarily include that header.Switch dashboards
Open the dashboard name in the toolbar to choose from your dashboards and the shared dashboards available to you. Access to a shared dashboard does not grant edit access or wider access to its underlying data.Edit a dashboard you own
- Select your dashboard and choose Edit.
- Use Add Widget to choose another widget, or Architect to open the Dashboard Architect.
- Arrange or resize widgets in the grid. Remove a widget from its card when you no longer want that placement.
- Choose Done to leave edit mode.
Refresh and configure widgets
Widget controls depend on the widget and your ownership:- Refresh widget appears for an owner when that widget enables refresh and is not already loading.
- Configure briefing appears for an owner’s briefing widget.
- A snapshot-backed widget shows a loading state while a refresh is pending, an empty state when no snapshot exists, or an error when its refresh failed.
- An interactive widget can load its own data rather than use a stored snapshot.
Export a snapshot
Choose Export as PDF in the toolbar to save a snapshot of the dashboard grid. An export captures the displayed view; it does not continue updating after download.Key state to watch
- Spend · 24h, Active runs and Interventions — the default dashboard’s summary metrics. A missing value is not proof of zero activity.
- A widget’s state — loading while a refresh is pending, empty when no snapshot exists, or an error when its refresh failed.
- Read-only shared dashboards — editing controls are for the dashboard’s owner.
Related surfaces
Review assigned work
Open your personal work inbox when it is enabled.
Inspect workflow runs
Follow running work and investigate completed or failed runs.