

/observe/traces) lists the run traces visible in your current organization scope. Each
row shows the trace and workflow identity, run status, start time, duration, tokens, cost, and step
progress. Failed-step counts are called out on the row.
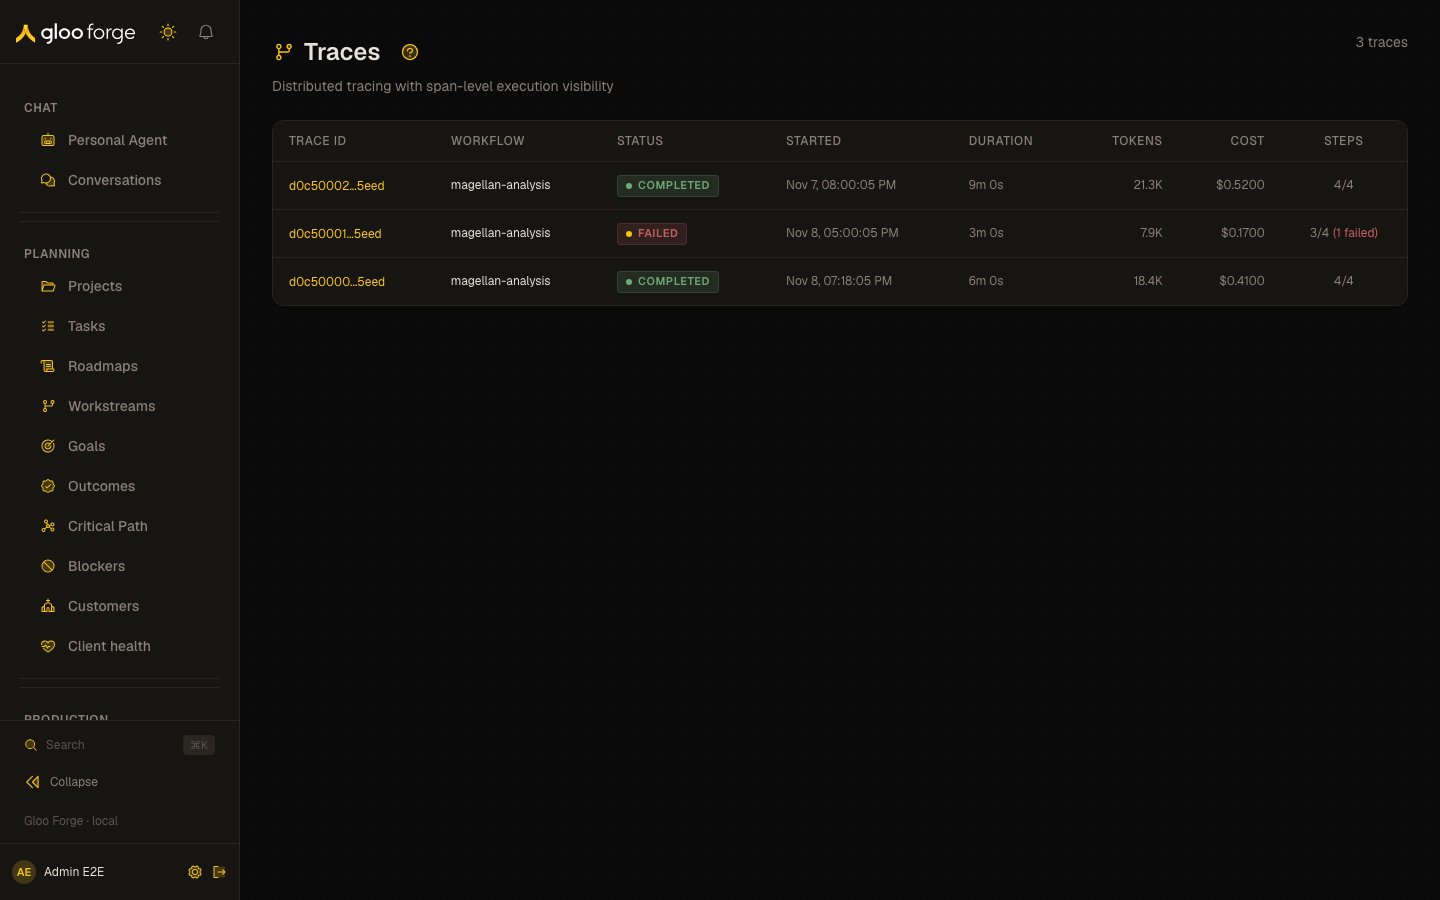
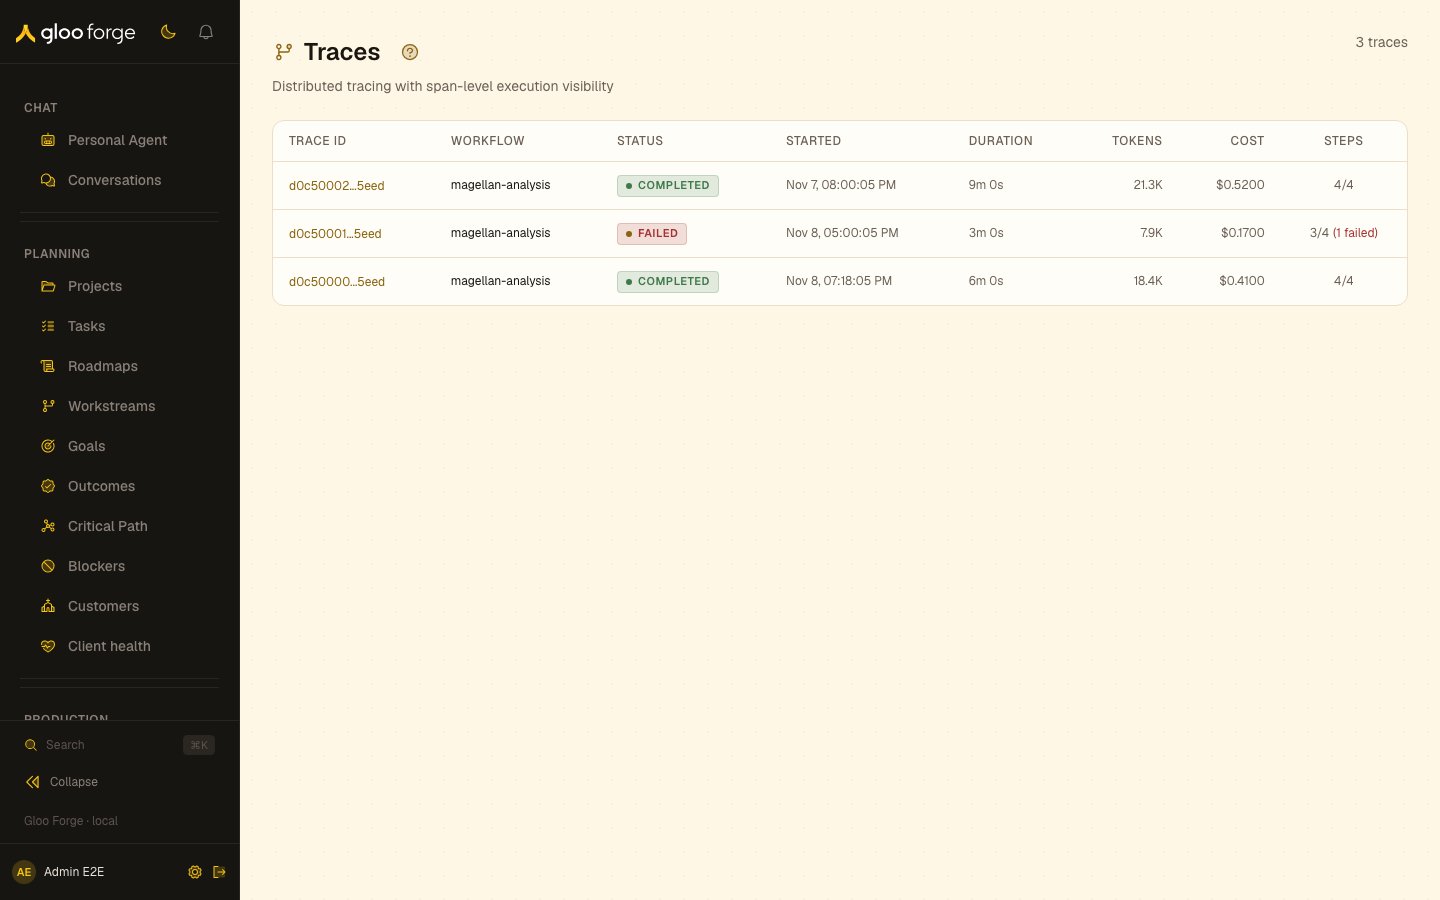
Traces — Forge Console at /observe/traces
What you can do
- Open a trace ID to see its run identity, timing, total spans, tokens, cost, and any run error.
- Use the Gantt-style timeline to compare step-span start times and durations. Select a span to open its Debug evidence: setup, agent and model, latency and cost, token counts, skills, tools, governance gates, neighboring steps, conversation, output, artifacts, and recovery evidence when those facts were recorded.
- Use Audit for the run’s governance and token-event evidence.
- Download the current trace detail as JSON from its header action.
Key state to watch
- Span status and duration — a running span uses the current time until it settles; a missing completion time on a terminal span does not become a measured duration.
- Run error versus span evidence — the run error appears above the timeline. Select the relevant span for its recorded error code, output, and recovery details.
- Missing evidence — older or non-agent spans may not have every Debug section. The page omits unrecorded sections rather than inferring them.
Related surfaces
- Runs: the run list and run detail.
- Runs and debugging: debug a failed workflow run.
- Reliability: failure rates across many runs.