

/production/runs) is the cross-workflow run feed. Every workflow execution writes a run row; this page lets you triage, inspect, and intervene without first navigating to the parent workflow.
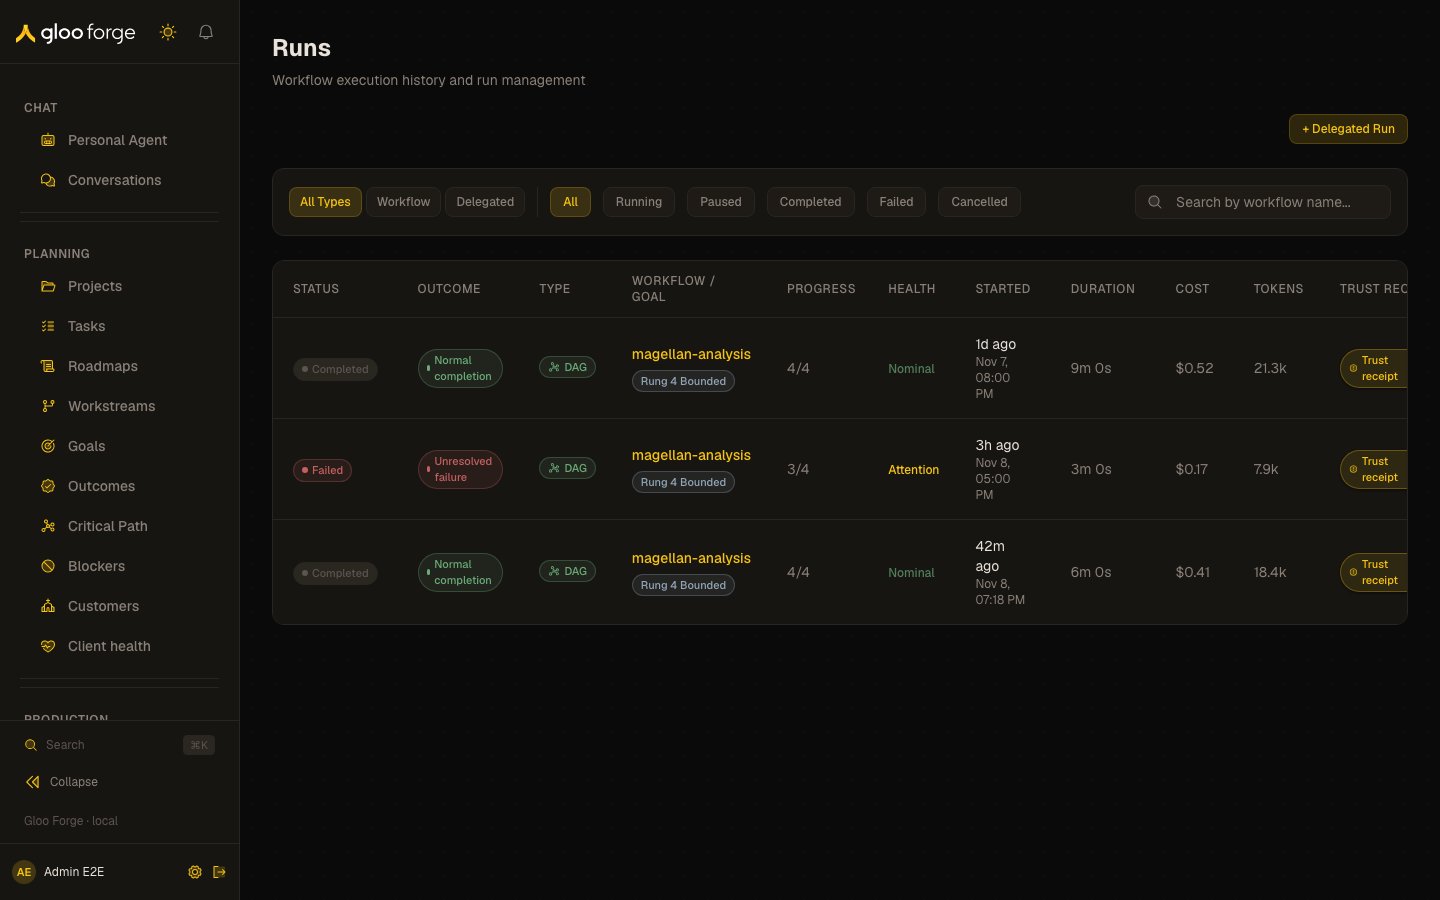
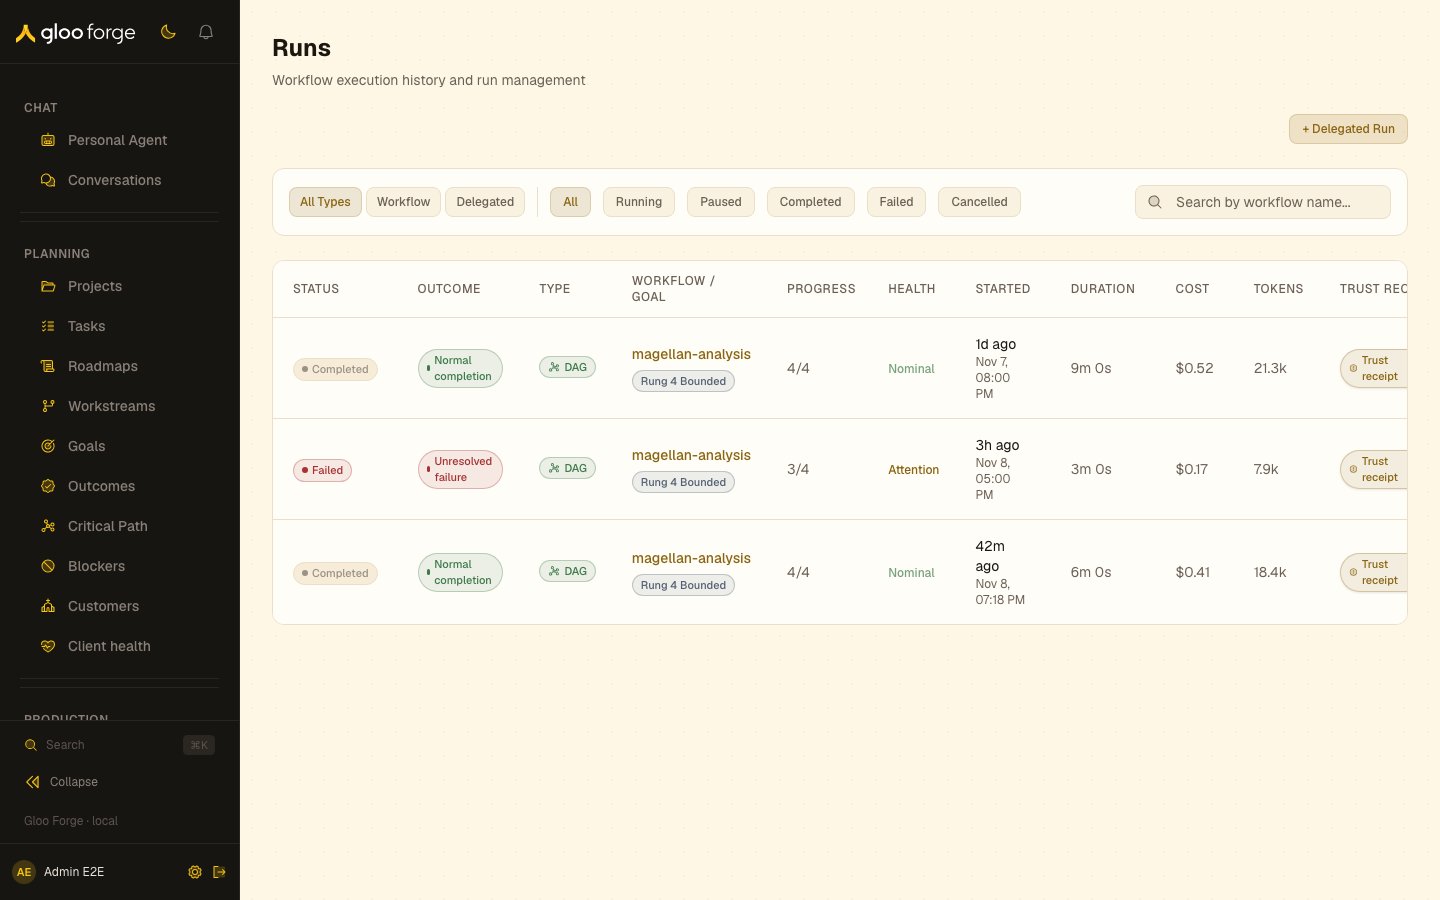
Runs — Forge Console at /production/runs
What you can do
- Filter the runs already loaded by type (All Types, Workflow or Delegated), status (All, Running, Paused, Completed, Failed or Cancelled), workflow name, or delegated goal. Next loads another server page when the current loaded rows do not contain enough matches.
- Choose + Delegated Run to dispatch goal-oriented work to an agent. The dialog records the goal, priority, authority posture, budget, deadline, and checkpoint interval before dispatch.
- Open a run to inspect its graph, timeline, step session, outputs, logs, validation, cost, and trust receipt. Use Sandboxes on the row when you need the run’s sandbox lineage instead.
- Cancel a live run from its detail page. Cancellation requires the run-management and emergency-stop authority checked by the server and asks for confirmation.
- Pause a running delegated run from the Intervention panel on its detail page. Pause asks
you to confirm, stops the current action and sets the run to
paused. A paused delegated run cannot be resumed; cancel it to end it. Workflow runs have no pause control. - Rerun a terminal run with modified inputs, or restart from an eligible step, when those controls are present on the run detail. These operations create a new attempt; they do not resume a failed run from the checkpoint list.
Key state to watch
- Status — Running, Paused, Cancellation requested, Completed, Failed or Cancelled. A cancelled run reads Cancellation requested while its in-flight steps finish, then Cancelled. State is driven by the orchestrator, not the UI.
- Paused runs — only a delegated run can be paused. Filter by Paused to find runs that are stopped but not ended; each one stays
pauseduntil someone cancels it. - Step concurrency — when a node fan-outs into parallel children, the timeline shows the concurrent slots they occupy.
- Cost — accumulates as tokens are spent. Crossing the workflow’s budget envelope is a governance event.
- Placement — whether an agent step ran Inline or in a Detached VM. See Where a step ran below.
Execution outcomes
The feed and a workflow’s Runs tab have separate Status and Outcome columns. Status is the run’s state, listed under Key state to watch. Outcome explains how execution ended. It reads — until the status is Completed, Failed or Cancelled:
New graph runs record this automatically, including legacy workflows; authors need no flags,
completion nodes or republishing. Normal completion does not claim the business objective succeeded.
For example,
applied_needs_review is a selected path fact, not automatically an exception.
Open run details for the explanation, evidence source and selected paths. Named affected steps link
to their evidence when that step is available. A historical failed run retains Failed even if later
handling evidence exists. Old runs remain unavailable until sufficient evidence is reconstructed;
missing evidence is never normal. A list read that reaches its evidence budget says to open details.
Trust receipt issuance and delivery remain separate from the execution outcome.
Trust receipts
The cross-workflow feed, a workflow’s Runs tab, and its run history show a Trust receipt status for each visible run. Issued opens the certificate in a drawer. On the run canvas, the persistent receipt control opens the same certificate in a centered dialog. A receipt identifies one workflow attempt and records its terminal result, Forge issuer, issuance and observation times, and evidence sections. Signature verification and evidence coverage are shown separately: a failed run can have a valid receipt, and a valid receipt can disclose missing evidence. Pending execution or issuance, failed issuance, and unavailable receipts have distinct statuses. Run rows and their normal actions remain available if receipt status cannot be loaded. Use Attempt to select another issued attempt. The picker lists the latest 25 known attempts and says when the history is truncated; an older receipt remains readable through its exact link while its source run is retained and you can read it. Opening the canvas receipt preserves your selected step, viewport, and replay state. An exact receipt link opens on any run tab. Switching tabs keeps the receipt open; closing it clears its selection while preserving the rest of your run navigation. Use JSON or Markdown to download the exact stored signed envelope. Verify it with a trusted public key for the stated Forge deployment and key ID. Receipt access follows the source run’s permissions; knowing a receipt ID grants no additional access. Historical runs can remain unavailable until historical discovery and issuance have completed.Where a step ran
An agent step’s header carries a placement badge with exactly two states:
Placement is decided by the node’s declared Timeout and nothing else — it is not predicted, and there is no toggle. To change it, edit the node’s Timeout in the builder; see Setting the runtime budget for a step.
Everything else is placement-blind on purpose. The Session feed streams identically from both substrates, governance runs once per dispatch either way, and cost attributes to the same run, step, and worker. The badge is the only place the substrate shows.
Router, join, and publish steps never dispatch an agent turn, so they carry no badge. Neither do steps from runs that pre-date placement — the badge is omitted rather than guessed at.
Liveness on a detached step — asserted, never inferred
A step that is running detached shows a Liveness row stating how long ago the VM last reported in (“heartbeat 14s ago”), because a two-hour node must never look the same as a stalled one.- Green heartbeat — the VM is reporting normally. Before the first report it reads
awaiting first heartbeat; a VM that is still spawning is legitimately quiet. - Amber heartbeat — nothing has renewed liveness for a full lease window (15 minutes), or the lease has expired. The row explains what happens next: the server-side backstop reaps the VM shortly after the lease expires, or you can cancel the run now. You do not have to wait out the declared deadline to learn a run is dead — that backstop is why declaring a generous budget is safe.
- Terminal — once the step settles, the row states the final status and stops ticking.
Cost on a detached step — two meters, one line
A detached step bills on two axes, so the cost row shows both and their sum:- Tokens — the agent/LLM cost, the same attribution an inline step gets.
- VM — compute for the VM itself, with its elapsed span. It advances while the VM runs and freezes at the real span when the step finishes. A VM waiting on model streams bills roughly memory, which is why an over-declared budget costs very little.
Cancelling and long-run notifications
Cancel reaches both placements — one button, one semantics. Cancelling an inline step aborts it at its next boundary; cancelling a detached step terminalizes the invocation and reaps the VM within one poll interval. The post-cancel state names what was reaped. Any run that takes longer than 10 minutes notifies the person who started it when it settles — a console bell entry (“Long run finished: …”) plus the Slack relay, linking straight back to the run. Shorter runs stay silent. Nobody babysits a two-hour run; the run reports in.A step can be “Done” and still have failed a gate
A step carries two independent outcomes, and the badge only shows the first:- Execution — did the step run and produce output? This is the
Done/Failedbadge. - Gate — did validation accept that output? A validator or schema gate runs after the step finishes.
- a failure card pinned above the tab strip, naming the gate code (for example
validator_agent_rejected) and its feedback, - a Gate rejected the step output entry in the step’s Logs timeline and in the run-level Logs tab, timestamped when the gate ran — which is after the “Step completed” entry,
- the rejecting verdict itself under the Validation tab.
A governance hold that an operator rejects also records a failure detail, but on a step that never ran. Those read Governance blocked this step rather than a rejection of output — there was no output to reject.
Reference: <id>., the handle to quote to an administrator. The Slack run thread uses the same rule.
Diagnosing a detached VM failure
When a detached agent step fails, the failure card separates the stable error code from the safe operator summary. It also shows the phase when known (stream, repair, or submit),
whether retrying may succeed, and a correlation ID for support or log searches. Provider response
bodies, prompts, tool payloads, and credentials are not rendered in this card.
Use the phase and retryability together:
- Stream — the model transport failed or exceeded the node’s remaining model budget. A timeout is retryable only when the card says so; otherwise inspect the correlation ID before rerunning.
- Repair — phase 1 did not satisfy the structured-output contract and the repair generation failed. The detached VM replays phase 1’s prompt, tool calls, and tool results into this round.
- Submit — generation completed, but the validated result could not be committed through the callback boundary. Check the callback error code and correlation ID rather than rerunning blindly.
Reading the graph
The run canvas draws the workflow as blocks, top to bottom. Every step is a card at a size you can read: the canvas opens at 80% zoom or closer and scrolls instead of shrinking a long workflow to fit.- Branches. Parallel branches sit side by side between two rails. The closing rail says how the branches join:
all,any, ork of n. A route that leaves the workflow and never comes back is listed in a dashed box beside its step instead of being drawn as a lane. - A live run shows the full definition. The running step spins, steps the run has not reached yet are pending, and a step waiting on a person or held by a policy says so. Exit rows carry a status too: a route the step decided against is dimmed and reads Not taken, and a step running inside an exit shows on its row, where Follow finds it. Cards never move as statuses change.
- An ended run opens folded to what ran. The routes a step did not take collapse into a dashed N not run box beside it. Click the box to unfold that step’s routes in place. Show full definition lays out every step again, with what never ran dimmed in place. Fold not run folds it back. If a run ends while you are looking at its full definition, the fold button is highlighted.
- Follow (live runs only) keeps the step that started most recently in view. Moving the canvas yourself turns it off. The choice is remembered in this browser.
- Cost heat gives each step a bar for its cost, measured against the run’s most expensive step. Critical path marks the chain of steps with the longest total duration.
- Replay keeps the ended run’s layout and replays each step’s status as it was at the playhead.
- Attempts. A run that was restarted has an Attempt picker. Pick an earlier attempt to see what it ran and where it stopped. While it is shown, the side panel gives the selected step’s status, duration and error in that attempt; outputs, logs and the conversation are kept for the latest attempt, and Show attempt N goes back to it. A run with more than 300 step attempts says “Showing the first 300 step attempts”.
- Finding a step. The search button jumps to a step by name, the fit button shows the whole run, and the overview in the bottom-right corner shows where you are. Zoomed out below 50%, cards show their names only.
- Keyboard. Tab into the canvas, then use the arrow keys: Down and Up follow the flow, Left and Right cross between branches, and Home and End jump to the first and last step. Enter opens the focused step in the inspector.
The step inspector — the Session feed
Selecting a step opens the inspector. Its first tab is Session — one feed that shows the whole session for that step: what the agent said, what it decided to run, and what the sandbox did about it, in causal order.- Conversation spine. The durable agent thread (prompts, assistant text, reasoning, tool calls, tool results) renders as the spine, streaming live while the step runs.
- Anchored sandbox output. When a step runs commands in a sandbox, each
sandbox_actiontool card carries an embedded terminal showing the stdout/stderr that command produced — output is attributed to the tool call that caused it, so a step that runs several commands keeps each one’s output on its own card. Expand a card to watch; collapse to see just the latest line. (The workflow tailer is always on, so expanding a card never changes what the run does — it only changes what you see.) - Progress narration. Sandbox progress/phase lines that aren’t tied to a specific command (for example, a long-running detached procedure) appear in a Progress strip above the spine.
- Knowledge citations. A citation of a knowledge case in the agent’s answer opens that case’s detail page in Knowledge when you can read the case, including a proven case the step was given up front. A case you cannot read opens nothing new.
- Aged runs. Live stream events are retained for 24 hours. After that the conversation spine is intact and each sandbox card shows its terminal status, but the raw command output is no longer available in the feed.
Context — what the step recalled and retrieved
The Context tab answers “why did it answer that?” for one step. It lists what was put in front of the step’s agent, grouped by kind and ordered by score, highest first:- Memories — the agent’s long-term memories that node memory recalled into the prompt.
- Facts — the saved facts it recalled.
- Cases — the knowledge cases it was given (a node’s proven cases) and the ones its
knowledge_searchcalls returned. A live case links to it on the Knowledge page. - Skills — shown only when a step recorded skill rows.
memory:read, is listed with its score as “Not visible to you”, marked Restricted.
The tab appears only for a step that is a real graph node; a trigger or end step has none, and a link to its Context tab lands on Session. Steps that ran before context tracking, and steps that are not agent steps, show “No recorded context for this step”. A rerun from a step keeps the same run, so the tab lists what every attempt of the step recalled, together; a rerun can show the same item more than once. A step shows at most 200 items, the most recently recorded. The blackboard and per-step skill or procedure versions are not shown here yet.
Below the recalled items, Searches lists each distinct knowledge search the step ran, newest first, with the query as the agent wrote it (secrets redacted). If you hold knowledge:manage, Replay this search opens Knowledge with that query, searching as the agent that ran it, so you can see what the agent’s search finds now within what you may read. The list reads the run’s 50 most recent tool calls; when the run has more, a note says older searches may not be listed, and a step whose searches are all older says so instead of showing none.
Artifacts — preview and download
Files a step produced appear as chips above the tab strip. Each chip does two things: click the name to preview the file in place, or use the download button on the chip to take the file without disturbing what you are currently inspecting. Each chip also shows its file size next to the name. Sizes above ~3.5 MB render in amber — that marks a file large enough that the platform staged it through the sandbox rather than sending it inline. It is informational, not a warning: nothing needs fixing, and it is the quickest way to see which branch of a fan-out is carrying the heavy payload. See Author a procedure for how procedures store and read files. The preview opens under a header naming the file and its shape, which matters when a run fans out several steps that all emit the same-shaped output:0 rows instead of merely looking short.
Large CSVs render the first 200 rows with a Show all control; the row count in the header is always the full count, not the rendered subset. Markdown, PDF, and image artifacts preview inline; anything else offers download only.
Downloads are fetched through the browser and saved under the artifact’s real filename. Very large artifacts (over 100 MB) open directly instead, in which case the browser chooses the filename.
Live cost & compute ticker
While a step runs, the Session header shows a live cost strip:- Booked cost and tokens are exact — they read the step’s recorded cost rows (agent/LLM cost) and update at each turn boundary.
- Sandbox compute shows booked cost once a sandbox lease closes. While a lease is still open, the figure is an estimate (labeled
est.) computed from how long the sandbox has been running at the platform’s compute rate — the same rate the closed-lease booking uses, so the estimate lands where the booked figure will. Estimated and booked figures are never mixed. - Elapsed ticks while the step runs and freezes when it completes.
Related surfaces
- Workflows — the definitions these runs execute.
- Delegated work — goal-oriented runs dispatched to an agent.
- Approvals — steps and commands a run is waiting on.
- Sandboxes — the sandbox lineage behind a run’s steps.
- Run History — run history across workflows in Observe.