

/observe/events to inspect the platform’s reactive event stream. The page reads a bounded window of recent events and updates as its subscribed data changes.
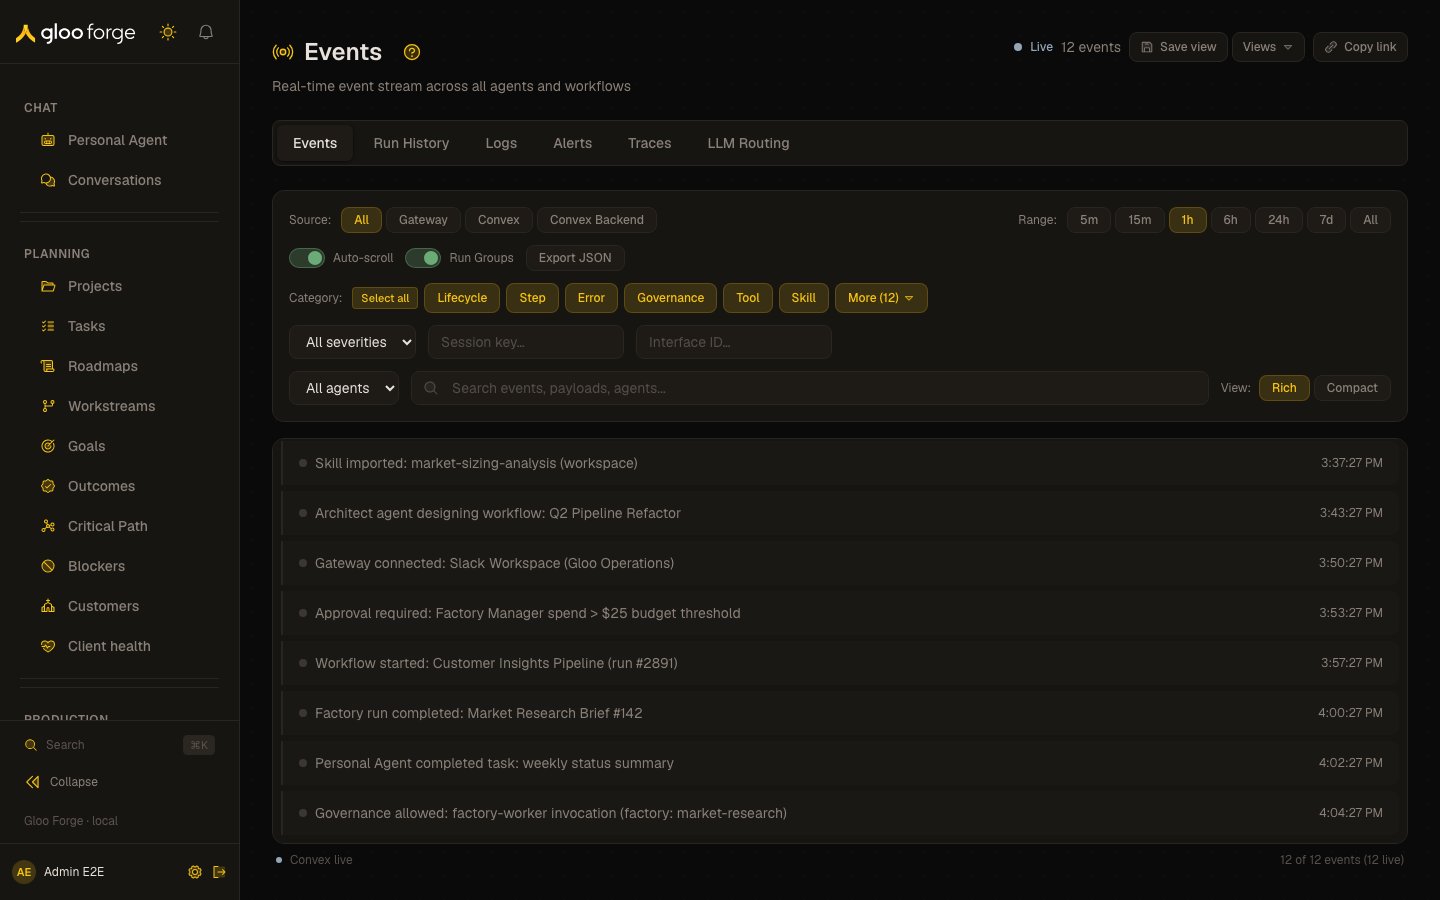
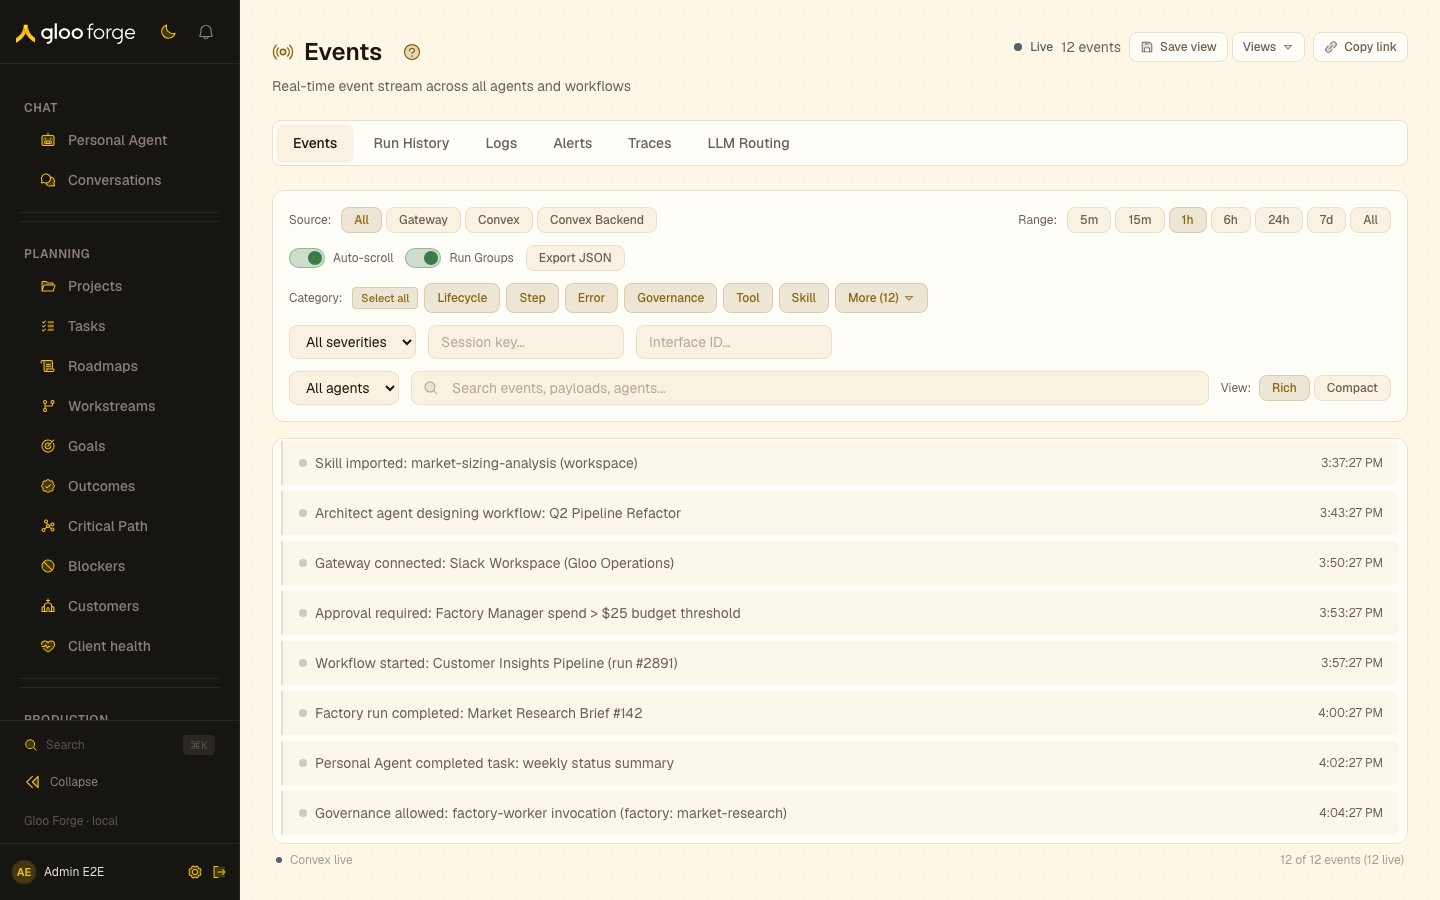
Events — Forge Console at /observe/events
What you can do
- Narrow the event stream by source, category, time range, agent or text. See Narrow the stream.
- Switch between rich and compact views, expand an event’s payload, and export the filtered events as JSONL. See Choose a view.
- Save a view, or turn it into an Observe alert rule. See Save or alert on a view.
Narrow the stream
Use the filter bar to choose a source, event categories, time range, agent, or text search. Additional URL-backed filters can narrow by severity, session key, or interface. The selected filters stay in the URL, so a copied link can reopen the same view. The default category set excludes high-volume Convex function events. Turn that category on when you need function-level evidence.Choose a view
- Rich mode uses event cards; compact mode uses rows.
- Run grouping is on by default in rich mode. Collapse a run when you need to scan unrelated events.
- Expand an event to inspect its payload. Resource and run links appear when the event provides enough identifying data.
- Use the page export action to download the currently filtered events as newline-delimited JSON (JSONL).
Save or alert on a view
Choose Save view to store the current filters. Saved views lets you rename, reopen, share, or remove saved filters for Events, Run History, and Logs. Choose the alert action to create an Observe rule from a saved-view predicate. Use Analytics → Alerts for metric-threshold rules instead.Turn outcomes
When recent agent-turn data is available, the summary above the stream groups outcomes by dispatch surface. A truncated label means the underlying scan reached its cap, so the displayed counts are a floor rather than a complete total.Key state to watch
- The bounded window — the all-time range requests up to 500 events and other ranges up to 1,000. A visible list is not proof that no older matching event exists.
- Convex function events — excluded by default; turn that category on for function-level evidence.
- A truncated turn-outcome label — the scan reached its cap, so the counts are a floor.
Related surfaces
- Saved views: keep and share a filtered view.
- Observe alerts: notify when matching events reach a count.
- Run History: the searchable activity and compliance log.