

/analytics/agent-performance) is the per-agent performance surface. The page exposes a four-tab nav across sibling Analytics pages — this page covers the Overview tab; each other tab is its own page.
- Overview
- Synthesis
- Builders
- Architect
/analytics/agent-performance — the per-agent roll-up table. Runs, success rate, total spend,
average cost per run, and last-active time per agent.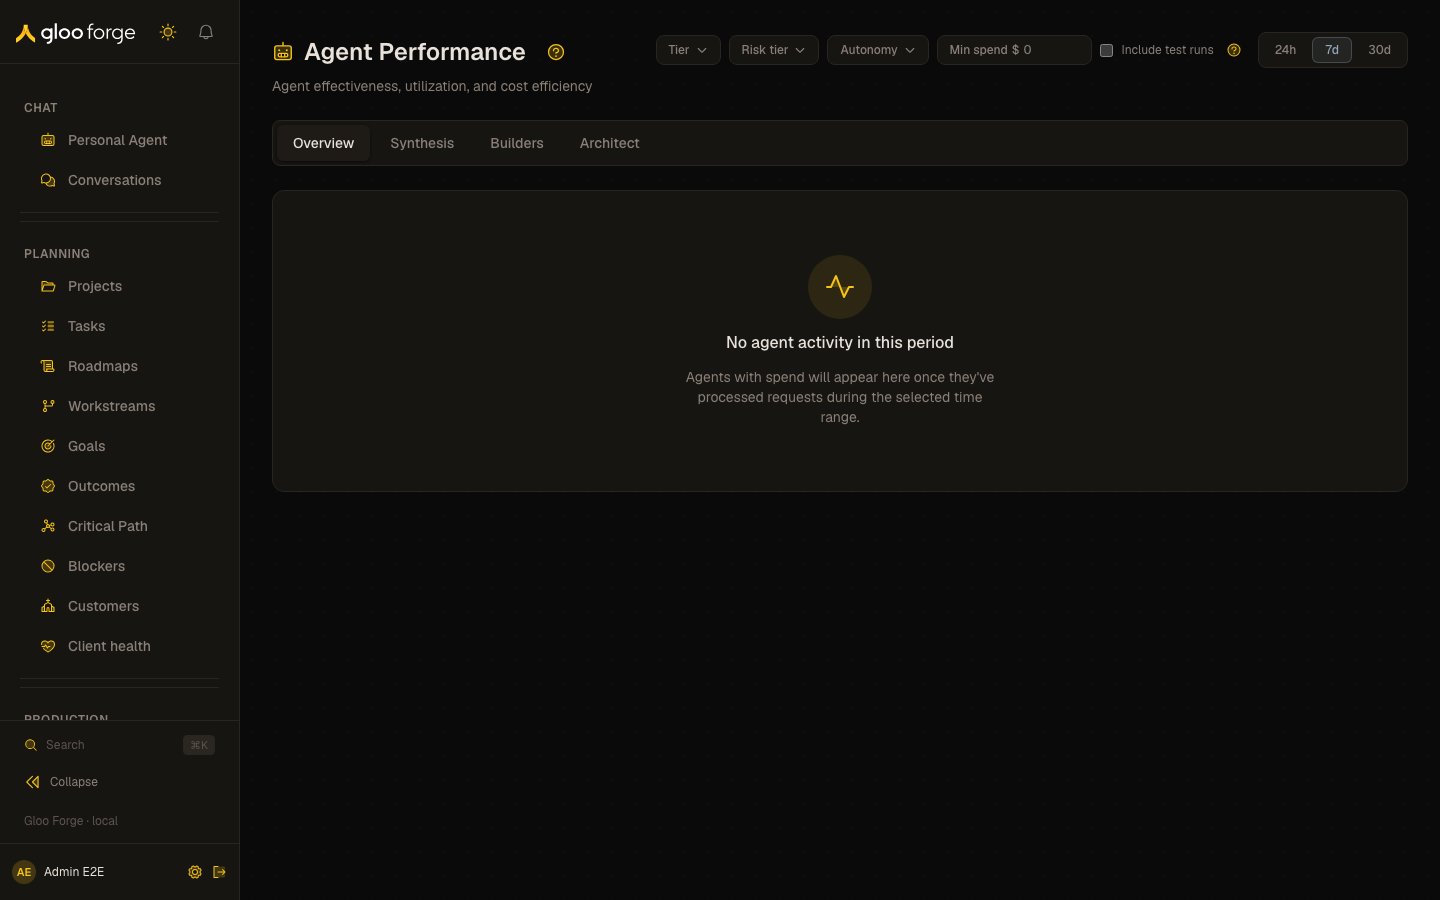
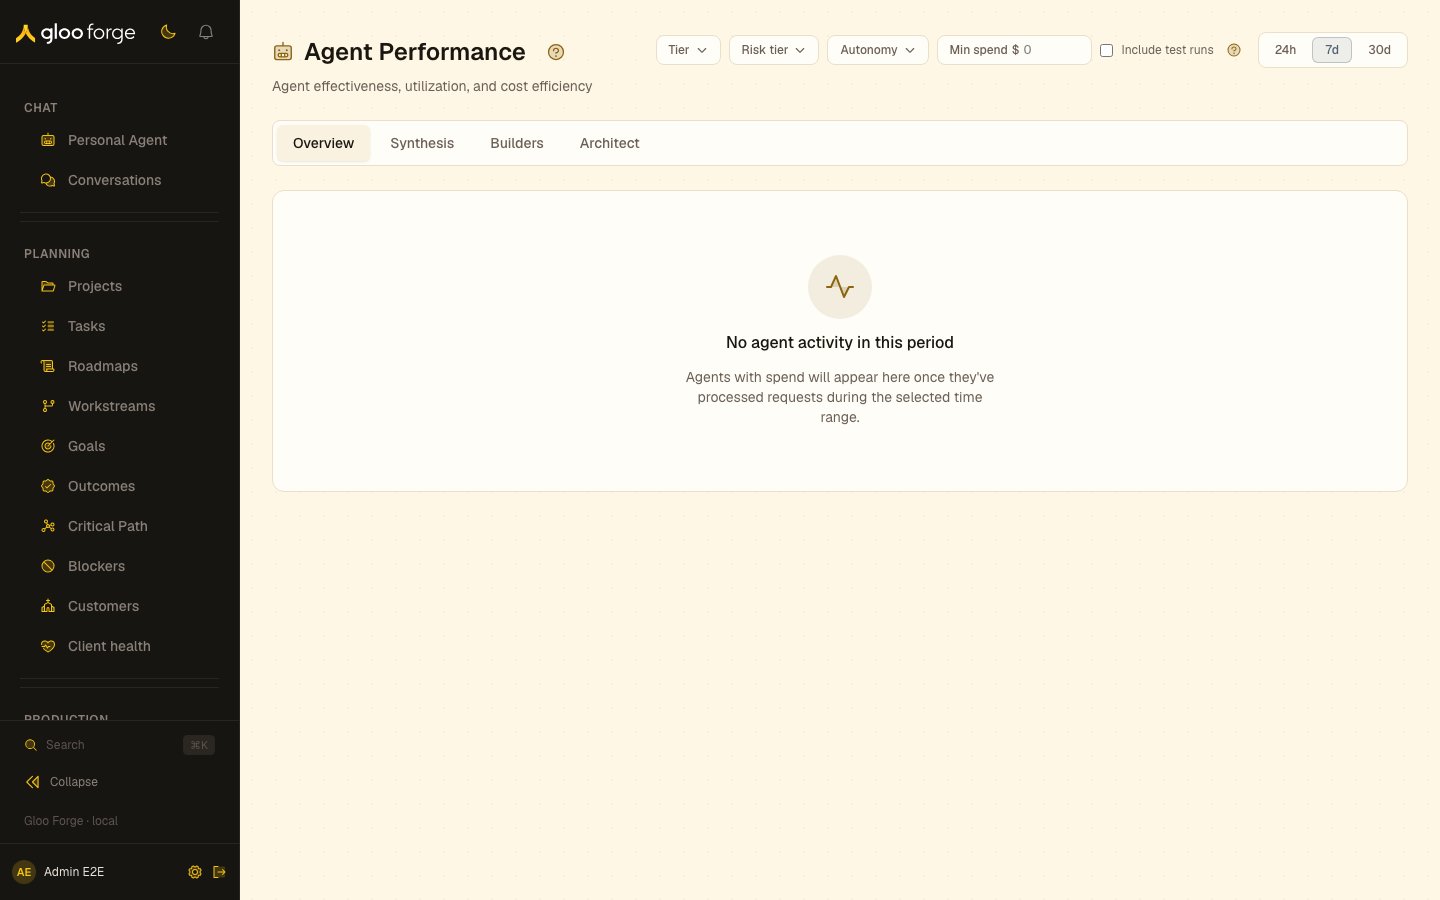
Agent Performance → Overview — Forge Console at /analytics/agent-performance
What you can do
- Sort by agent, runs, success rate, total spend, average cost per run, or last active.
- Filter by agent tier, risk tier, autonomy rung, minimum spend, and time window. Clear filters restores the leaderboard when a combination excludes every row.
- Expand a row for its current tier, risk, autonomy, and cost details, or choose the agent name to open its Workforce detail page.
- Read the page note before treating the test-run toggle as a filter: the aggregate currently lacks a run-kind dimension, so these totals include production and test runs even when the toggle is off.
Key state to watch
- Runs — the number of roll-up runs in the selected window, not a fixed 30-day dispatch count.
- Success rate — absent evidence is shown as
--, rather than as a zero-percent result. - Total spend and Avg / Run — use both to distinguish a high-volume agent from an expensive individual execution.
- No agent activity — only agents with spend appear. If filters are active, the page distinguishes “no match” from a genuinely empty period.
Related surfaces
- Reliability: run success and failure rates across the workspace.
- Cost: the spend behind the cost columns.
- Agents: an agent’s configuration and readiness.